This is the third post in our series expanding upon the data strategy techniques outlined in our white paper, “Developing a 2022 Amazon Data Strategy.” Check out the previous posts on collecting and connecting and enriching.
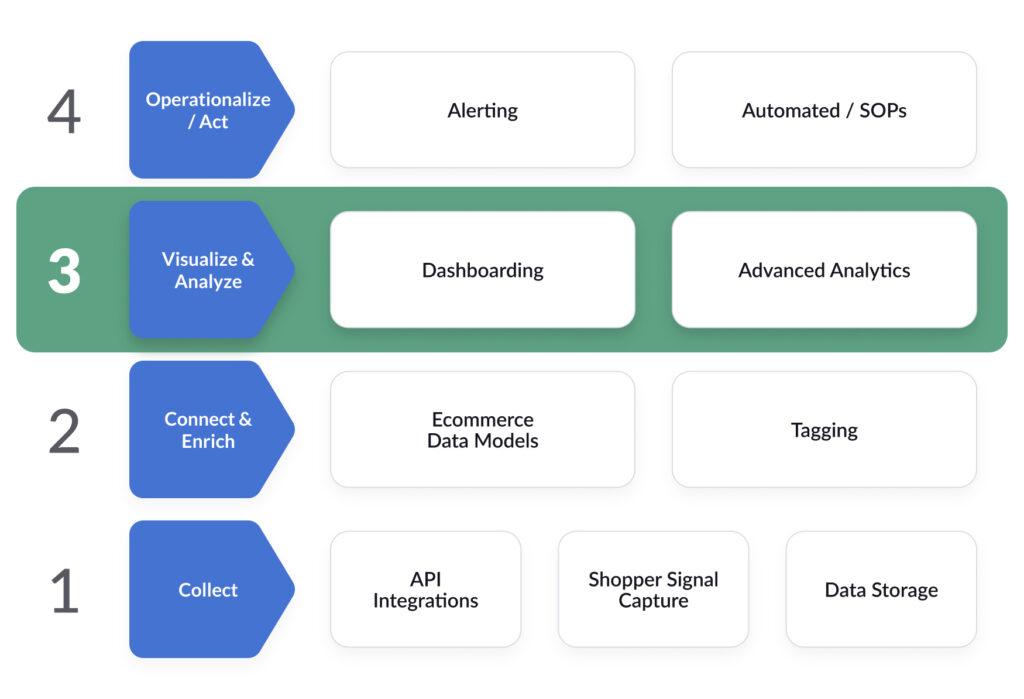
Once a brand or agency operating on Amazon has collected, connected, and enriched its data, the company can advance to the next step in its data strategy—extracting value through visualization and analysis.
Critical and frequent questions should drive your dashboard design.
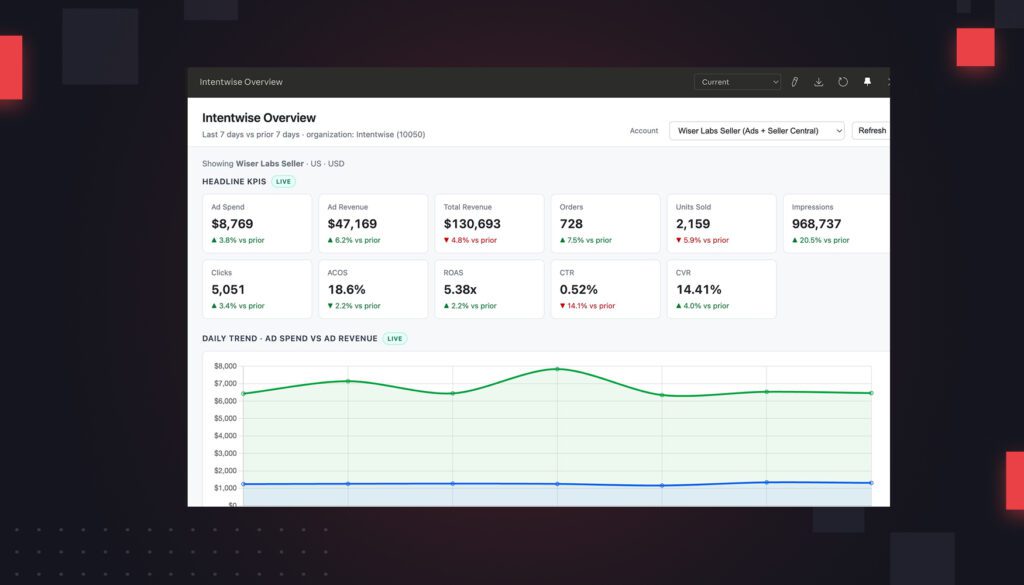
Dashboards and reports—like those provided through Tableau, Microsoft Power BI, Google Data Studio, ThoughtSpot, and even Microsoft Excel—allow companies to monitor and analyze business performance in a streamlined fashion. To create these dashboards, ecommerce teams must bring together domain and data expertise. Amazon and ecommerce agencies have the added onus of monitoring, understanding, and presenting a cohesive story about performance to their clients.
Dashboards get stale—and that’s a good thing.
In organizations that are putting data to good use, dashboards tend to get stale quickly, which is a good thing. This is because users are trying to ask new and interesting questions constantly, which helps propel the organization forward. Dashboards must be revisited and revised regularly as the questions they are answering evolve, and ecommerce teams need to make sure they have the resources to accomplish that.
Ad hoc analysis is a necessity—set up a process for it.
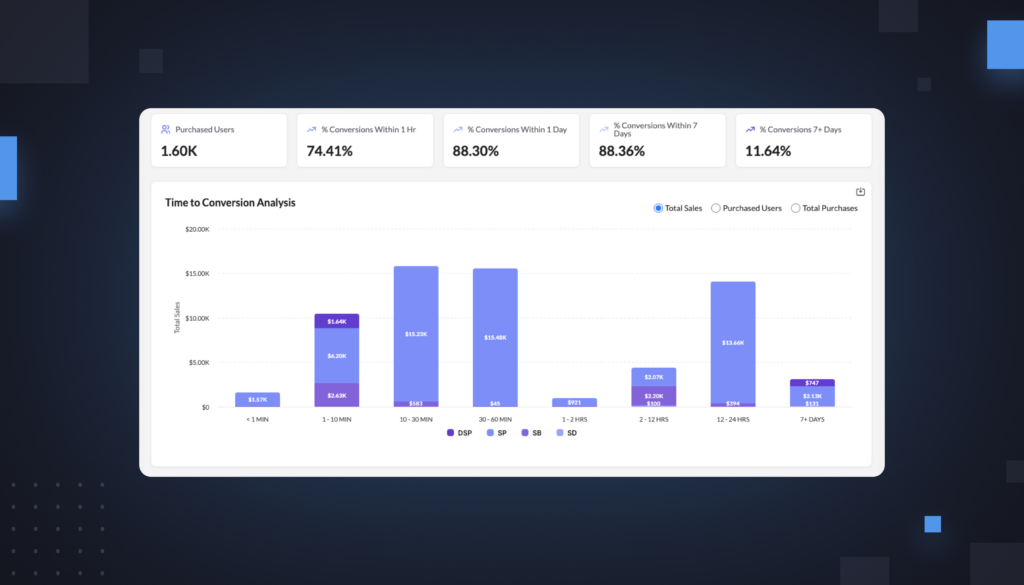
Ecommerce teams often have to go beyond a dashboard’s predefined questions and seek out the “why.” This requires ad hoc analysis, which is a continuous four-step process:
- Build a list of great questions that’ll help your team do something differently tomorrow.
- Rank them by your team’s assessment of impact, if possible.
- Build the visuals or execute the analysis. Most of the time, ecommerce teams can extract data into a spreadsheet and analyze. More sophisticated analysts may turn to statistical tools such as R, SASS, or even Solver in Excel.
- Templatize repeated analysis to streamline the process next time.
Next up: The final step in a data strategy—operationalize and act.