")
More than ever, brands are talking about profitable growth on Amazon. That’s great—but the discussion tends to be missing one key element.
Namely, in order to reach profitability, you have to build a clear view of where your money is going in the first place.
Amazon doesn’t present this information for you, and creating your own profitability calculator on Amazon is especially difficult, given that there are so many chargebacks, subscriptions, and other fees to factor in.
Every day, you want to know: Which products are driving your highest profit margins? Which are driving your biggest losses? And how, if at all, is that changing over time?
Building an Amazon profitability calculator for each item in your catalog helps you zero in on your lucrative products. You can then use that profit knowledge to implement broader business changes:
- Make smarter product pricing decisions.
- Ensure you are not over- or under-investing on ads for specific products, given their profitability numbers.
- Identify any major red flags, such as high return rates that are cutting into profitability or a product that may never reach profitability at its current price because the COGS is so high.
Ultimately, you can’t actually maximize your profitability if you don’t know your profitability numbers at the ASIN level.
And most brands don’t.
Aisha Khan, VP of Strategy and Insights at Momentum Commerce, told us on a recent podcast that most brands take 30+ days to calculate their profitability numbers.
According to Khan:
I’d say 90% of brands out there who are selling on Amazon don’t have even monthly real-time reporting of their P&L.
Why is this basic profitability data so hard to access? Khan has a simple answer: “Because of the time it takes to rectify and check and review these reports and consolidate,” she told us. “Amazon doesn’t make it easy, Walmart doesn’t make it easy.”
Why should you build a profitability calculator on the item level?
There is no universal definition of profitability. But when we’re discussing item-level profitability, generally what we are referring to is some variation of:
Total Sales
– FBA Fee
– Referral Fee
– COGS (Cost of Goods Sold)
– PPC Costs
– Coupons
– Refunds
– Storage Fees
= Item-level profitability
On paper, that might seem like an easy calculation. The challenge for brands, though, is gathering those numbers in the first place.
These metrics are surprisingly hard to get from Amazon and Walmart. Your PPC data is held in one report, for instance; your FBA fees in another; and then many brands aren’t even tracking COGS, period.
In total, in order to create an Amazon profitability calculator, we at Intentwise generally join together tables from 4 different reports.
If you do it yourself, you have to manually download and join these disparate tables on a daily, weekly, or monthly basis. It’s a pain, and it takes a long time.
That’s why so few brands even know their item-level profitability—and why even those that do often have a months-old view of it.
If there are any surprising shifts in your profitability, you might not find out until too late.
COGS is a specific challenge
When you’re tracking your item-level profitability, you’re probably going to run into a lot of trouble with your cost of goods sold (aka your COGS).
The big issue: You need to account for changes in your COGS over time.
You can’t just calculate the COGS for each product once. As market conditions change, so will your COGS.
In Intentwise Analytics Cloud, we automatically update your profitability calculator when you enter a new COGS value. This enables you to always have up-to-date data on profit margins, while maintaining your historical view of performance.
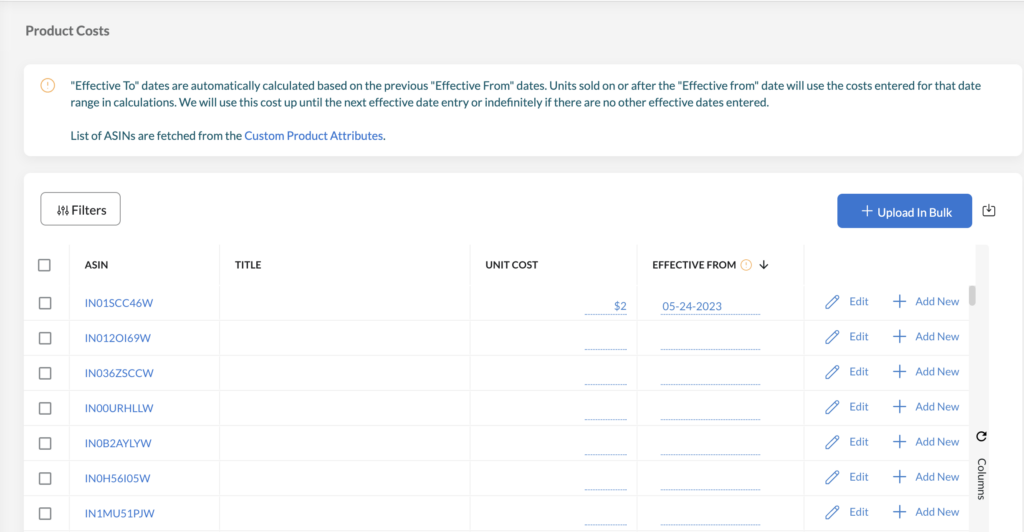
Are your costs going up or down? And how is that impacting your profit margins on Amazon? Now it’s easy to find out.
So how can you build an item-level profitability calculator?
To calculate your profit margins on Amazon, you have two main routes:
Option 1: The manual approach
If you’re so inclined, you can download and join all of your advertising, FBA, and refund reports from across your accounts.
Assuming there are no issues with the reports you downloaded, simply subtract all of the selling fees and other expenses. Repeat this process for every day/week/month that you need to view your profit margins, and boom—you have a manual profitability calculator.
BACtrack, a leading brand of personal breathalyzers, used to do this. BACtrack operates both Vendor Central and Seller Central accounts, plus separate vendor and seller advertising accounts. In other words, it was pulling in 6 different reports from 6 different accounts, with different formats and formulas to calculate profitability for each.
Every day, the company needed to download a fractured series of reports across its various accounts—marketing reports, business reports, inventory metrics, and more—and unify them all to see its profitability numbers.
At first, BACtrack joined all of these reports together using Google Sheets and other templates. The problem? As BACtrack recently explained to us, this process was time-consuming, and it was hard to stay up to date.
By the time that BACtrack was able to calculate item-level profitability, there was always a risk that those numbers had gone out of date.
Option 2: Partner with an Amazon data provider
With a tool like Intentwise Analytics Cloud, you can pull up a constantly refreshing view of your profitability numbers by ASIN without having to lift a linger. We automatically connect, collect, and visualize all of your disparate reports for you.
We also make it easy to track your key profitability metrics, like COGs, over time. That way, you can easily see where you’re improving on the profitability front—and where you still have work to do.
Want more content like this every week? Be sure to subscribe to our weekly newsletter.