It’s Monday morning, and you’re logging into your ad account. Suddenly, you realize that your ACOS doubled since last week. You ask yourself: What happened?
If you’ve ever managed ads on Amazon, you’ve likely run into this scenario. For better or worse, you encounter major changes that you can’t immediately explain by actions you took.
To figure out what’s going on, you might start downloading reports from Amazon and pore over trends data, all to decipher what caused the swing in performance. This can be a painstaking process.
Your ACOS is the result of a hierarchy of different metrics, with their own performance swings.
Every account-level change is a result of some combination of:
- Portfolios
- Campaign type
- Campaign
- Brand vs. non-brand keywords
- Keywords
- Product targets
- ASINs
Out of all of these, which one is worth paying attention to?
Introducing What Changed
Intentwise is excited to introduce What Changed, a new feature in our Ad Optimizer that will be rolling out shortly. We think it’s going to revolutionize your analysis.
What Changed is essentially a ranked view of the many, tiered swings in your account performance over a given time period.
All you do is define two time periods, and then let our AI and machine-learning algorithms compare everything in your account and summarize the changes for you in order of impact.
To start a What Changed analysis, you first need to choose two time periods to compare. Let’s say you want to run a month over month analysis. Within the What Changed tab, select Feb 1-15 and March 1-15, and sit back as we calculate the most important performance shifts across those two time periods.
The data we give back to you not only shows you the immediate, top-line changes over those time periods, like this:
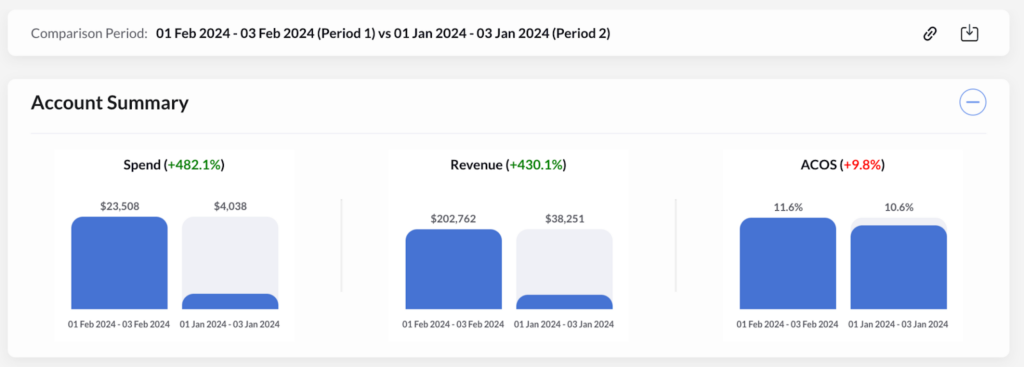
But we also go further. We break down those same changes across all of the levels of your ad stack (keyword vs. ASIN vs. campaign type).
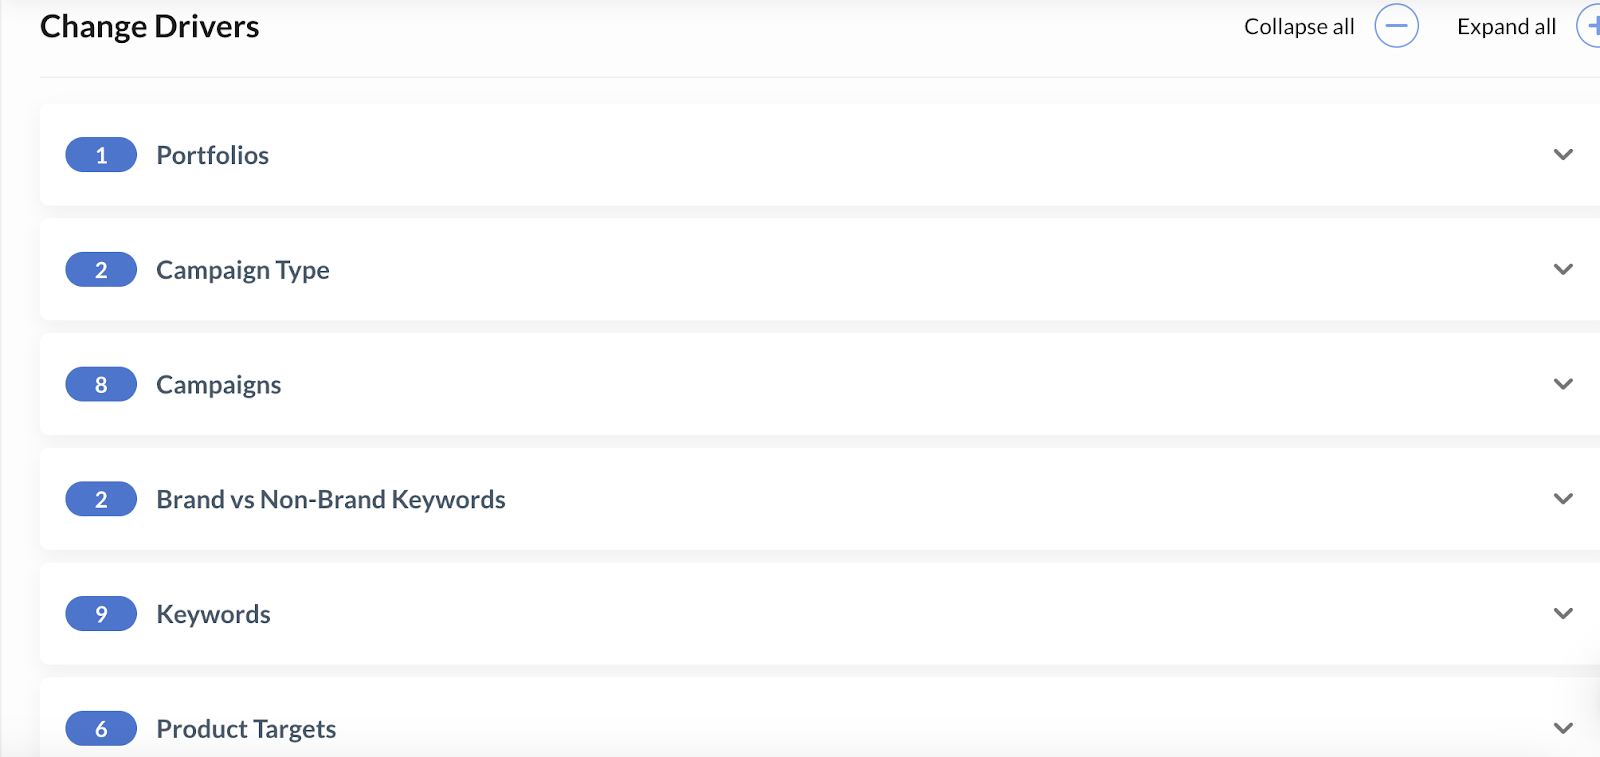
Click into any of these layers, and you’ll immediately get a ranking of which campaigns are the biggest drivers of change for your account.
That way, busy account managers can identify the most important shifts at a glance.
Here are two special features within What Changed:
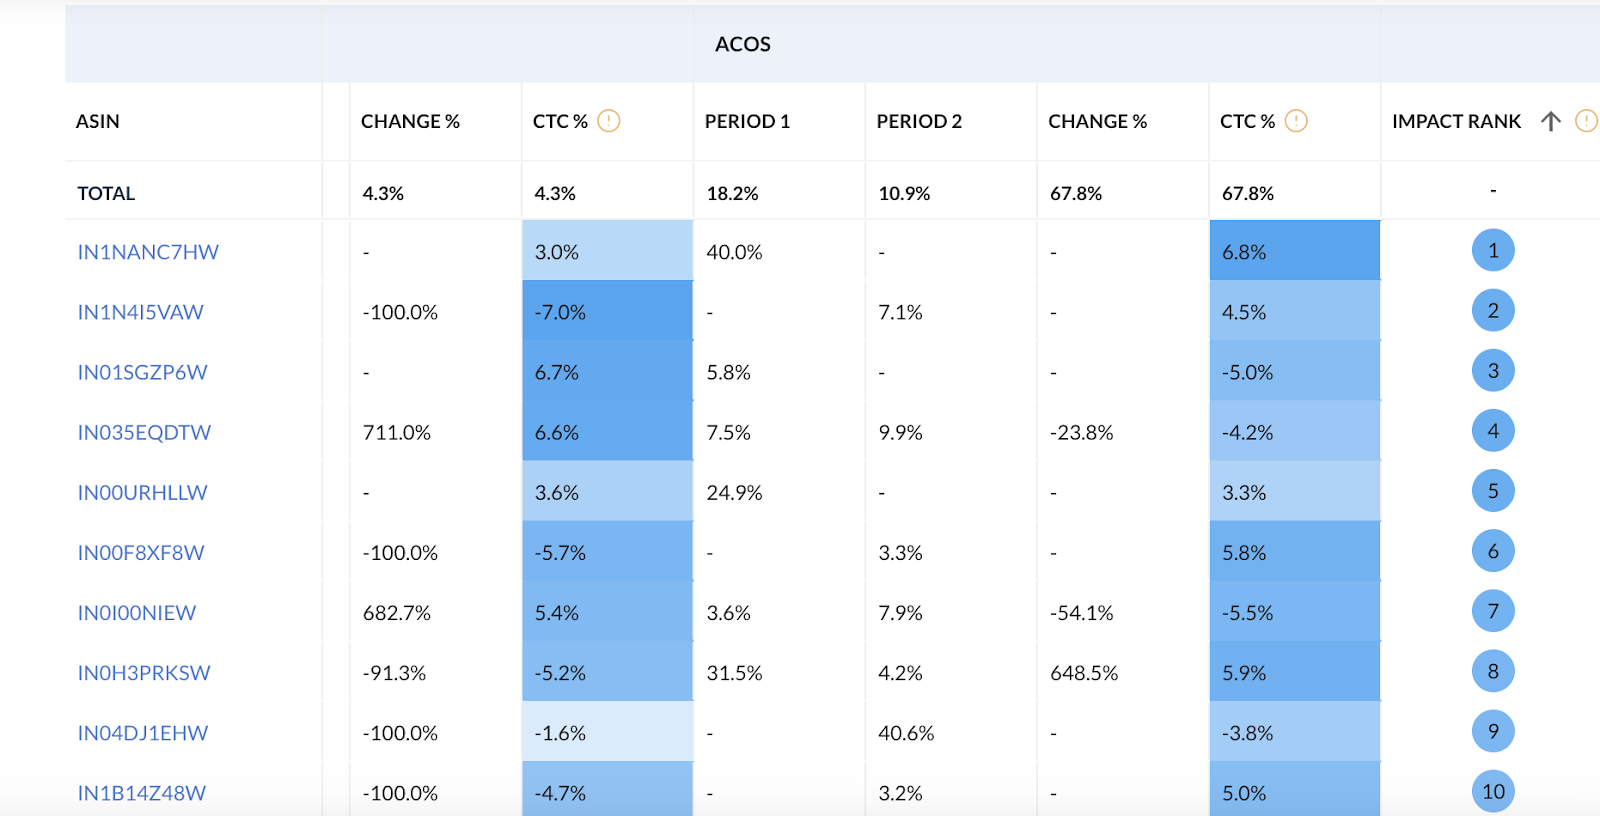
Pressed for time? Look at the impact score. One of the most important parts of What Changed is the score we assign to an individual entity’s contribution to the overall change in your account performance. These are called Impact Scores. Every product, campaign, keyword, and so on gets one.
How does it work? Impact Scores combine three main metrics that drive shifts in your performance—ad spend, ad revenue, and ACOS—into a simple score that tells you which changes are most significantly impacting your account. These calculations are done through a mix of machine learning and AI technologies.
Is there a particular ASIN that is responsible for the change in performance? We’ll highlight that for you. Or maybe Sponsored Brand Video campaigns started spending through the roof recently, and they’re affecting performance across many ASINs.
Keep your eye on the mix change. In What Changed, we also showcase a metric called Mix Change. Mix Change measures the change in the share of your total ad spend that is allocated to a given portfolio, campaign, keyword, and so on.
If SBV campaigns drop from representing 25% down to 20% of your total ad spend, for instance, then the Mix Change would be -5%.
What can you use What Changed for?
Because you can set your own time periods, we think you can do pretty much any type of analysis at a glance with What Changed. But here are a few possible use cases:
Identify trending products. Say you’re doing a simple year-over-year What Changed analysis.
When you open the analysis across your ASINs, you might find that one ASIN had a very big drop in ACOS from one year to the next, even as ad spend levels remained about the same.
That probably suggests the ASIN is trending more than you realized and might be worth putting some ad money behind.
Double check seasonality. Are you seeing an unexplained swing in account performance? You may be trying to remember whether it’s a normal season shift, or whether it indicates something more profound.
The solution is easy: Run a comparison to the same period last year, and see what has changed between now and then. Is your ACOS about the same? Did the same ASINs that are seeing worse ACOS numbers now also have a dip in performance last year?
Prepare for shopping events. Let’s say we’re a few days out from a big shopping event. Maybe you want to compare your performance ahead of Prime last year to your performance ahead of Prime Day this year.
What Changed makes it easy to get a gut-check on how you’re doing.
What can’t What Changed tell you?
Of course, all of these suggestions are just for preliminary trend identification. What Changed isn’t supposed to be the end of your analysis. It’s the starting point.
Our goal is to make it easy to identify big swings at every level of your account at a glance. That way, you have plenty of time to get back to the work you’re best at: Generating and testing clever new ad strategies.
Book a demo of the Ad Optimizer today if you want us to help you with everything in between.