![[Table] Blog Post (1)](https://www.intentwise.com/blog/wp-content/uploads/elementor/thumbs/Table-Blog-Post-1-scaled-q7uyqdmkajyxk37umckgjbyfgps0hzbvqb0bakkq4g.jpg "[Table] Blog Post (1)")
If you’ve been advertising on Amazon or Walmart, you’ve certainly run into this dilemma. You log into your account one day, and you realize your ad revenue dropped unexpectedly.
What went wrong?
Figuring out why your stats changed—why your revenue went down, why your ACOS jumped, and so on—isn’t easy. There is just so much data to sort through before you can locate the culprit.
If you’re a big enough brand, you probably run dozens or hundreds of ad campaigns, each of which contains hundreds of keywords and product targets. Not to mention, these campaigns cut across many categories—there are Sponsored Brands campaigns, Sponsored Brands Video campaigns, and so on.
That’s a lot of data points to track.
What’s the best method for identifying ad revenue changes?
To identify what is going wrong—or, if your revenue is up, what is going right—you first need to download the data from Amazon or Walmart.
Then, comb through each line of the spreadsheet to find the campaigns, keywords, search terms, and more that are responsible for that sudden shift in performance.
How do you sort through all of this data? We recommend laddering down through your account. Start with the highest levels of your ad system, and then work your way down until you’ve identified the specific ad entities that might be the problem.
Here are the layers, in order, we recommend that you go through:
#1. Overall account: This will likely be your signal, in the first place, that something has gone wrong. If your overall account revenue is down 10%, for instance, then you want to figure out what happened.
#2. Campaign types: The next step is to see whether a certain type of campaign was responsible for that drop in ad revenue. You should look through all of your categories of campaigns—SBV campaigns, SP automatic campaign, SP keyword targeting campaigns, etc—and see whether one in particular is the reason behind that big revenue drop.
#3. Campaigns: Once you’ve identified the campaign type that might be at fault, you want to look at your specific campaigns. Are one or two of the campaigns disproportionately responsible for your revenue decrease? Those are the ones to focus on next.
#4. Keywords/Product Targets: Now you’ve reached the level of figuring out exactly why your revenue is getting so much worse. In the underperforming campaigns, are certain keywords most responsible for your overspending?
#5. Search Terms: Similarly, can we trace back the underperformance to a few long-tail search terms that were previously driving significant volume?
By the time you’ve reached the keyword and search terms layer, you’ll hopefully identify what needs fixing. It’s very possible that you can trace a big drop in revenue to a handful of badly performing keywords.
Remember: Don’t evaluate change—evaluate contribution to change
During this troubleshooting process, there’s one trap you should avoid. For every line item you evaluate, make sure you are contextualizing its performance against the overall spend associated with that line item.
Just because one keyword or campaign has a big drop in the revenue it generates doesn’t mean it’s responsible for your overall performance issues. If it doesn’t receive a lot of spend, then it probably isn’t the culprit.
Here’s what we mean: Let’s say you discover that Campaign A had a 30% decrease in revenue last month. Your natural instinct might be to assume that Campaign A is responsible for your account-level revenue woes, right? But if Campaign A is only a fraction of your overall spend, then it probably isn’t the problem.
Meanwhile, Campaign B—your biggest campaign—might have seen a modest 5% increase in revenue, but since it is responsible for so much more spend, then it is more likely the problem.
That, in essence, is the difference between Change % and Contribution to Change %.
Change % just says by how much the revenue is going up or down—but the Contribution to Change % accounts for the extent to which a single keyword or a single campaign is impacting your account overall.
What if there was an easier way to identify account-level changes?
The system we discussed above works, but it is extremely time consuming.
At Intentwise, we wanted to make it easier for brands and agencies to figure out what is driving increases or decreases in their revenue.
So, this month, we launched a new feature in Intentwise Analytics Cloud that automatically measures Contribution to Change %.
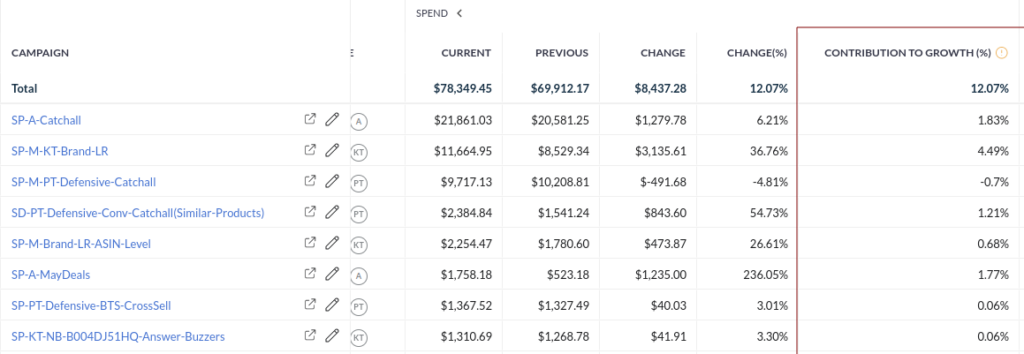
Rather than comb through a complex spreadsheet, brands that use Intentwise can see a flashing sign that says: Here’s the line item that’s contributing to your sudden increase in spend.
For now, we are able to measure Contribution to Change % for spend and revenue. That means we can identify the keywords, campaigns, product targets, and so on that are responsible for a sudden increase or decrease in spend or revenue. (From there, it’ll be easy to calculate metrics like ACOS.)
In the near future, we’ll add impressions and clicks as a measure, so you can get the same view across those two categories.
Do you have a strategy for decoding fluctuations in your spend or your revenue? We’d love to know.
(Want more content like this every week? Be sure to subscribe to our newsletter.)