
React to market changes faster with trended AMC data



.png)
We all know that Amazon Marketing Cloud unlocks deep intelligence about your product performance—but less discussed is how, when you’re tracking these AMC insights over time, you can react proactively to broad market trends.
Think about the metrics you can uncover with AMC: New-To-Brand rates, LTV, repeat purchase rate, first-touch and linear-touch attribution, Subscribe & Save, and much more.
When you run an AMC query, you get a static snapshot of these numbers for each of your ASINs.
That’s useful, to a point—but in the real world, as competitive pressures and economic trends alter shopper behavior, these numbers can swing significantly.
By trending your AMC data, you ensure you’ll actually anticipate these market shifts.
Which AMC data points should you trend over time?
As an example, think about your ASIN-level NTB rates. Even a novice user of AMC can easily figure out which of their ASINs drive the highest number of NTB shoppers.
But again, think of the trends. Which of your products are seeing a gradual decline in NTB rate? And which are gaining steam?
Studying these trends allows you to react to market shifts.
If you notice that one SKU far back in your catalog is quickly growing its NTB purchase rate, then you should put extra marketing spend behind that product.
Don’t get caught flat-footed and let your competitors crowd you out.
Here are a few great use cases for trended AMC data:
LTV-to-CAC ratio. Forget ROAS. Your LTV-to-CAC ratio is the best measure of the efficiency of your marketing spend.
The beauty of this metric is that it takes into account the long-term effectiveness of your ad spend.
You’re certainly willing to spend more on ads if you know the typical shopper repeats their purchase several times, for instance.
By trending your LTV-to-CAC data over time, you essentially give yourself a live view of the overall health of your marketing.
If you’re seeing the ratio go up, that means your ad spend is paying more dividends.
If the ratio is dropping—either for certain products, or across your portfolio—you have a problem.
Your ad costs are going up, and the typical shopper isn’t spending enough to make up for them.
Studying trended data helps you flag these trends and react quickly, so you don’t actually leave money on the table.
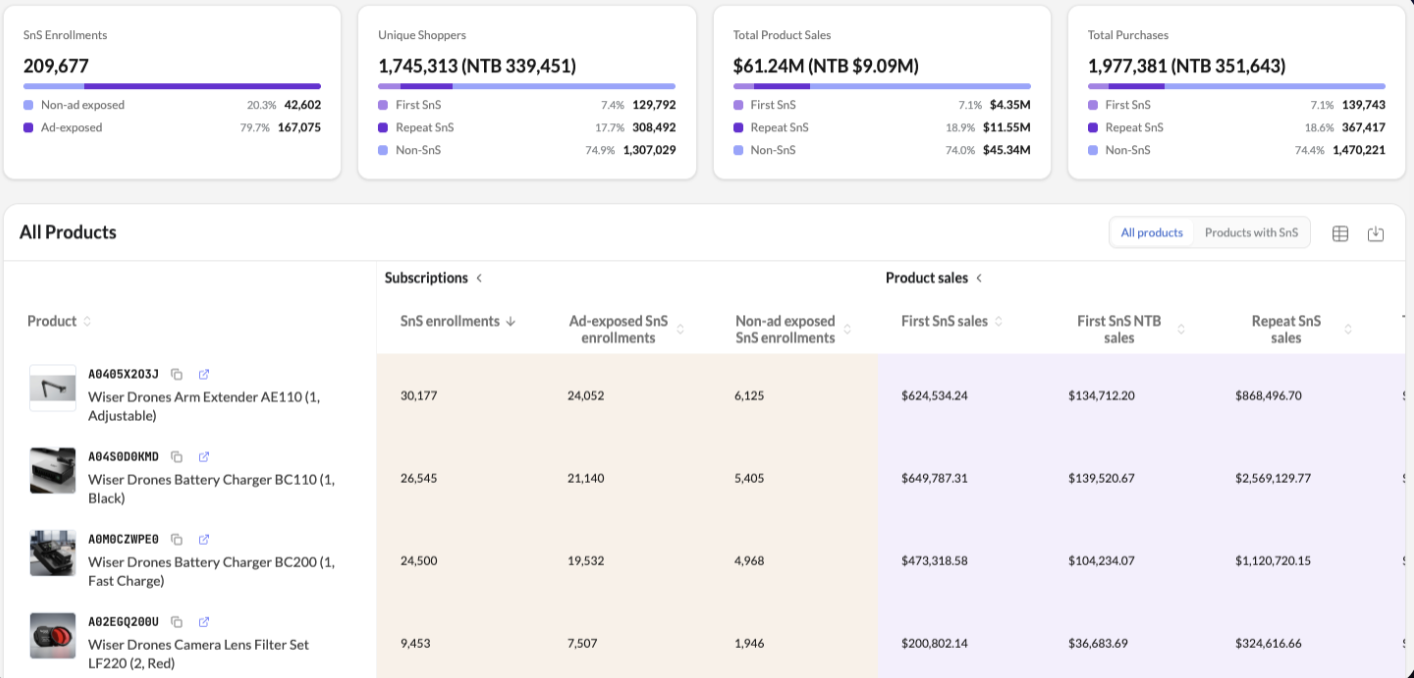
Subscribe & Save. While Amazon does have a Subscribe & Save dashboard natively in Seller Central, Amazon Marketing Cloud is the only way to get a granular view of your Subscribe & Save performance.
With AMC, you can uncover your subscriber retention rate and subscriber revenue per ASIN (among many other data points).
Trending this data lets you catch negative trends on the subscription front before they become a problem.
Is your overall Subscribe & Save revenue for certain ASINs dropping? What about your subscriber retention rate?
By the way, we recently published a whitepaper deep dive on driving Subscribe & Save growth with better data. In it, we talk quite a bit about trending your subscriber data.
Find that here if you haven’t already downloaded it.
Path to purchase. AMC answers all your questions about which sets of ad interactions or other shopper events are most likely to drive a purchase.
When you trend this data, you’ll be able to spot promising new paths to purchase, and then shift your ad spend accordingly.
If a DSP Streaming TV ad followed by a Sponsored Products ad is seeing its conversion rate steadily tick up, that’s a sign to up the spend.
Cohort matrices. The more sophisticated approach to trended AMC data involves creating 12-month cohort matrices for all of your ASINs.
Basically, with cohort matrices, you can track all of the key data points across your entire catalog.
Automatically flag which ASINs are seeing jumps or declines in LTV, NTB, subscriber revenue, repeat purchase rate, and any other vital metric.
This is the ultimate command center for your business—a place where you can check in on all of the deep changes your products have seen every 12 months, and re-strategize accordingly.
How do you actually trend your Amazon Marketing Cloud?
Now, let’s get into the logistics. AMC runs on individual queries—which means, to track trends over time, you need to run the same query again and again.
Then, from there, ensure the results from each query are fed into a dashboard.
You can do this automatically with Intentwise Explore, our AMC acceleration platform: schedule queries at your chosen intervals, and feed the results into our dashboards, or into custom visuals we build for you wherever you already work.
The reality, however, is that trending this data is far easier when you connect your Amazon Marketing Cloud data to Claude.
Intentwise’s AI Gateway MCP funnels your MCP data—along with the rest of your multi-channel data—into your AI agent, plus adds in our knowledge layer to ensure top-quality responses.
With a MCP like ours, you’ll still have to run individual queries in AMC every week or whatever your chosen schedule is, but Claude can very quickly build for you whatever trended view of you want.
Ask Claude for a view of NTB trends, per ASIN, over the last year, and Claude can create it for you within minutes.
Or ask specific questions, like “Which of my products have seen the biggest drop in NTB rate in the last 2 months?” or Which product has seen the greatest increase in subscriber retention?,” and Claude, using the AMC data you already connected, can pull up a list for you.
It can be that simple.